

Investor complacency was rife. Since January 2016 investors have not experienced any significant corrective action on equity markets. Volatility had been unprecedentedly subdued. The “short vol” trade was a slam-dunk that lured in many investors, most of whom did not understand the risks of trading volatility.
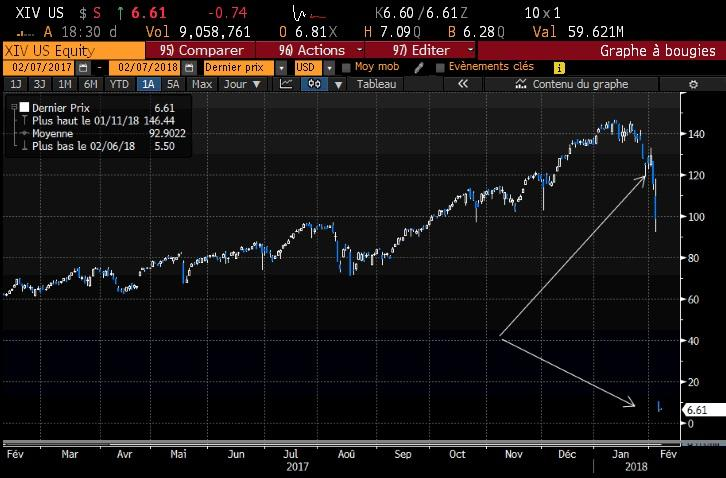
Over the past week, complacent investors who forgot that equity markets remain a risky asset received a brutal wake-up call. A 3000 point wipe-out on the Dow over a couple days was not expected by anyone, to say the least. Dip-buyers who have become accustomed to buying the -10 point intraday pull-backs on the S&P 500 got reacquainted with the notion of stop-losses. Those gambling in the volatility products hopefully understand now that the VIX is not an asset class and benefits no one. Indeed, the VIX can – and did – double in value. For an inverse VIX ETF, well that means the product goes to zero. And that is just what the Velocity Shares Inverse VIX fund (XIV) did this past week. Many inverse VIX ETNs were halted. In our daily market update for February 8, we warn of another class of ETFs that may also in turn implode in the event of extreme price movements.
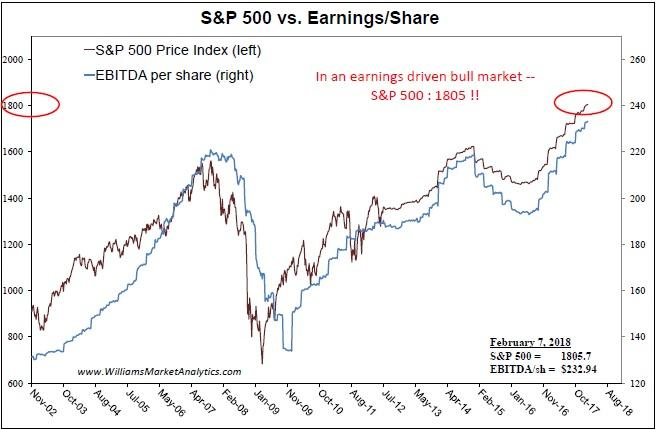
Reading sites like Seeking Alpha or listening to the sell-side analyst on CBNC, you would believe that earnings are responsible for this extraordinary move in stock prices. The “earnings driven rally”. Well, not quite. We re-worked our EPS chart (which can been seen on our Valuations Metrics page) to show the theoretical evolution of the S&P 500 price based purely on an “earnings driven rally”. We see that the S&P 500 would be trading around 1800 today. The S&P is now in the 2700 neighborhood – about 33% overvalued based on earnings. Yeah, an earnings driven rally, right.
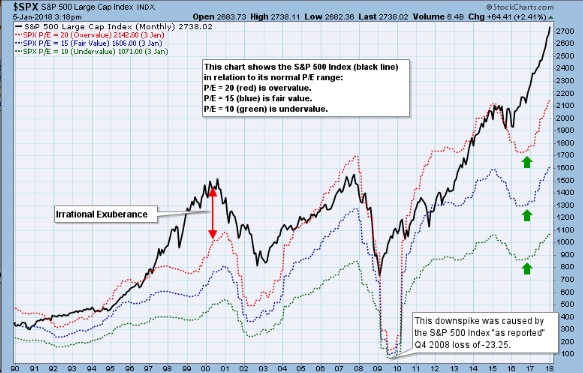
A colleague forwarded the following S&P 500 valuation chart which is also interesting. The S&P 500 (in black) is traced with several P/E bands showing historically high valuations (P/E of 20x, or over-valued, in red), fair valuations (P/E of 15x, or fairly-valued, in blue), and low valuations (P/E of 10x, or under-valued, in green). Note that these P/Es are based on trailing earnings, so if earnings are indeed set to accelerate significantly, this analysis needs to be taken with a grain of salt. The current 12-month trailing P/E ratio on the S&P 500 is 21.8x. Indeed expensive. However the P/E based on consensus forward earnings estimates is now at 17.3x. Elevated, but not exaggerated. We must add that Wall Street analysts tend to be a very optimistic bunch. For them the glass is always half full, and if they err in their forward-looking estimates for a company, they will err to the upside. More importantly, if earnings rise as forecast over the next quarters, prices would need to stay steady to keep valuations in the reasonable range. In other words, the markets have paid in advance for these earnings. Now we need to hope that earnings grow as forecast (to avoid a market crash) or even exceed forecasts (to see the S&P 500 rally further).
Is This The One?
Of the 24 pull-backs since 2009, the mini-correction this past week feels different. The market had gotten very frothy as risk-on got out of control. Just look at Bitcoin’s 20 fold run-up. Our WMA U.S. Market Risk Indicator just about touched 100 the last week of January. Individuals are streaming into the market. Equity funds are getting record cash inflows. The equity rally has drawn in the retail investors and the general public. Even President Trump is touting the stock market rally with his now ubiquitous question in front the cameras, “how is your 401K doing?” Finally, unlike for most of 2017, bond yields are trending up. The 10- year U.S. T-Note yield is now above 2.80%. We’ll comment more on the rates market in upcoming Commentaries and daily Market Updates.
The VIX volatility index, known as the Fear Indicator, has been at record low levels since the U.S. election, signaling complacency in the markets. The problem with the VIX, as many had argued, was this the index was “broken”, failing to rise in the face of many seemingly risky events over 15 months, including North Korean missile tests. Another indicator we use to measure complacency is the Total U.S. Market Short Interest / U.S. Total Market Cap ratio. This one is spectacular. Everyone is in – let the party begin! Shorts have thrown in the towel, buying into crowded stocks with the retail investors. We only have data back to 2008, but at 6.6% short interest we are clearly at the bull market low. If there are no shorts left to be squeezed out, there will be no more forced buy-ins. Coupled with the extreme optimism recently observed, the rally is losing an important motor in its move higher – the conversion of stalwart bears.

Most cycles tend to end on an event that is either unknown or unexpected, so the market doesn’t know how to discount it. Worse, bubbles tend to end on nothing. What caused the collapse in 1929? Why did the Tech Bubble stop in March 2000? Market historians have even been unable to cook up a spurious explanation for these bubble tops. Today’s bubble may very well top on nothing but good news. The argument that higher interest rates are the explanation for the stock sell-off seems tenuous. The strongest phases of the stock market rally over the past two years occurred from the Brexit low in June 2016 and from the August 2017 “low” (if you can call the equity retreat last August a low). Well, the strongest move up in rates also occurred starting in June 2016 and in September 2017. Blaming rates is great for those who need to find a nominal, rational reason to explain the irrational. We remain open-minded – the bull market may likely end with no known reason. After all, major bull markets have never ended during periods shrouded with investor skepticism or with some easily identifiable cause.
Conclusion
Many are warning that the current market rally may end in a blow-off top. We are wondering how January’s explosion in U.S. indexes can not be considered to be the blow-off top. Everyone seems to want to fix their objective for equity prices just a bit higher, just like Wall Street banks keep revising S&P 500 price targets higher once old targets are hit. Reasonable market commentators (such as ourselves) must entertain the possibility that the January peak in U.S. indexes was the blow-off top in this cycle. We are watching closely the snap back rally this week, which we called for after Monday’s thrashing. We remain vigilant in looking out for a lower high on the S&P 500. We believe that there must be lots of “overhang” created by January’s rally (investors who bought late, not wanting to miss out on the 2018 continuation of the bull market).
Overhang is created by late investors who find themselves immediately underwater and seek to get out near their late purchase price on any rebound. The amount of overhang orders could be large and provide significant resistance, preventing the S&P 500 from regaining the January highs.