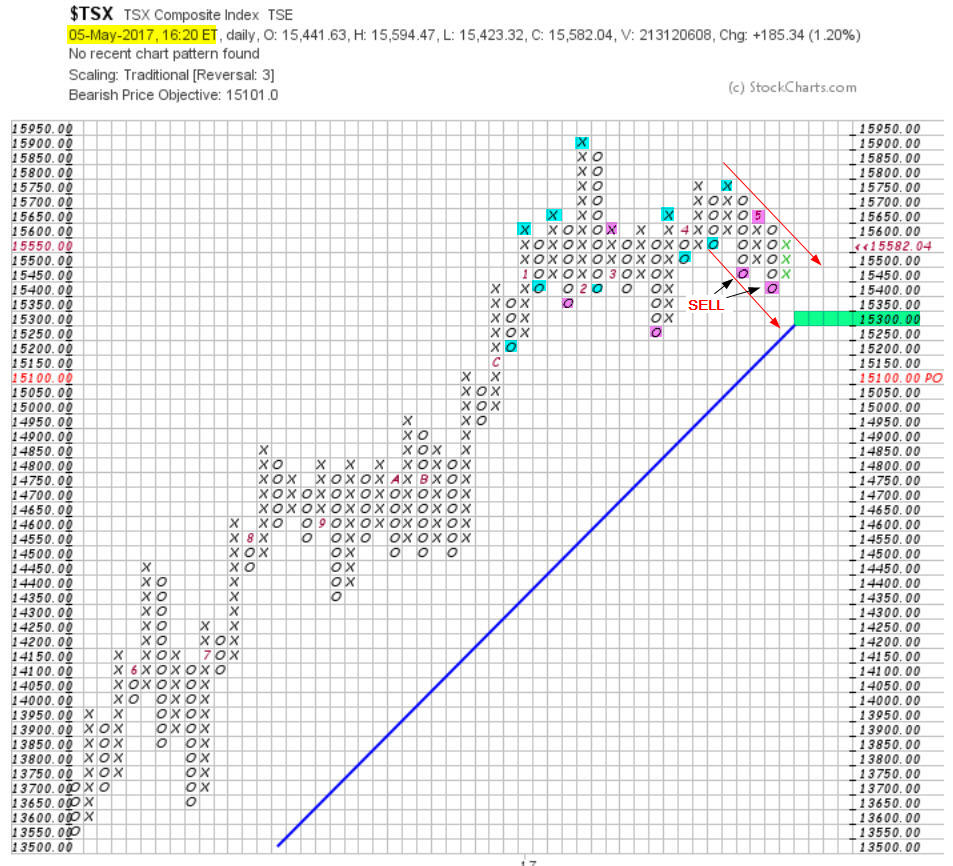
Several weeks ago May 5th in a comment on this website, I brought to reader’s attention a Point and Figure chart of the Canadian TSE index which to me spelled trouble ahead..

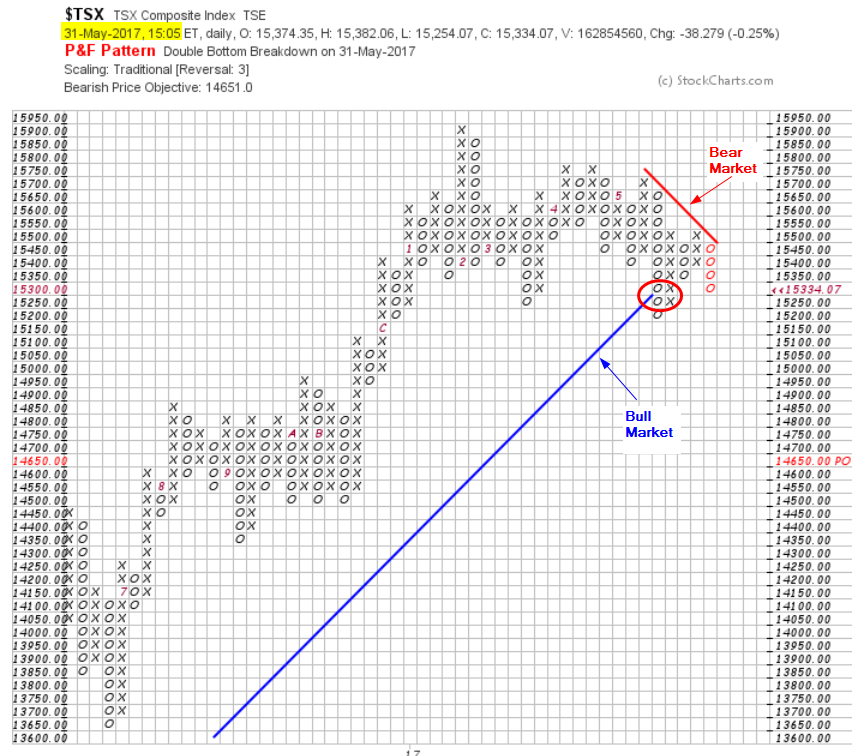
It took more up and down movement within the longer term trading range but eventually the market decided to break the long term bullish line (in blue) while I was on a two week trip outside the country. The situation as of today is as follows:

After the breakdown, the market tried to rally but the Bearish line (in red) stopped the ascent and today we have another double bottom breakdown at 15,300.
In my initial comment, I mentioned that this breakdown would create a bearish environment and the sell signal would precede the “crowd” signal which is a break below the 200 day moving average currently at 15,204.53 providing ample time for investors to liquidate their risky positions.
Financials are hurting, oil stocks are in a downtrend, mines and metals are not doing better. The three cylinders have no more oil to lubricate them. Beware of the next few weeks.
/Pierre

