November 29, 2023
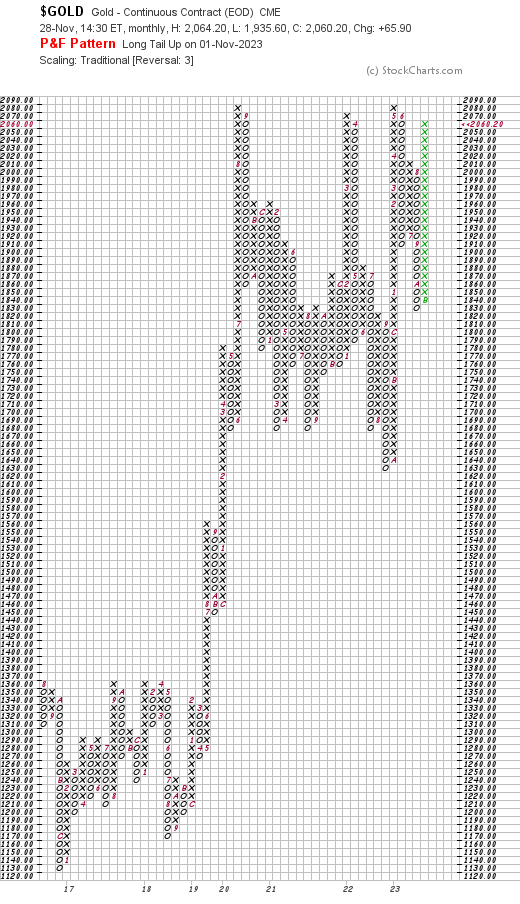
Now that $GOLD has broken above the 2020 level, and is at 2040, remember that I stated a few days ago that the next and most important technical level is 2090.
The Point & Figure chart shows that 2090 is the break-out point. Above that, there is no supply (i.e., resistance). Traders will likely do for $GOLD what the chart shows they did in May 2019, at 1370. With only two pull-backs, they quickly zoomed $GOLD to 2080.
$GOLD traders are soon to watch history.


