

From U.S. Thanksgiving 2015 and again in 2016, one of the industry groups that enjoyed a substantial price recovery in capital markets was Natural Gas. But, following the May-June 2017 price collapse and subsequent grinding down of prices of Natural Gas stocks, we are now wondering if the time is right to become invested again, Thanksgiving 2017.
Investors in our Natural Resources fund know that we have positions in three of our 12 Oil & Gas holdings that are primarily Nat Gas operators. These are Devon Energy (DVN), Newfield Energy (NFX) and Gulfport Energy (GPOR), which are respectively large-cap, mid-cap and small-cap stocks whose 12-month performance (as these notes are being prepared) has been a dismal -18.1%, -25.9% and -41.6%.

If there is some good news here, it could be their bullish performance over the past quarter-year. DVN, NFX and GPOR are up +23.1%, +21.3% and +6.1%, which is excellent considering we started up the Nat Res portfolio almost three months ago. Although the process has recently started, this action is known as a trend reversal.
Higher Crude Oil (USO) and Natural Gas (UNG) prices would be the catalyst that NG stocks need to continue their recent bullish performance. With WTI Crude Oil price popping higher today (Nov. 22) to about $58, and from June forward after it had dropped down to ~$43, it’s likely that the Natural Gas price (presently just under $3.00) will follow along with the recent move higher in Crude Oil prices, as it did in 1H2016.
In the following chart from StockCharts.com, the UNG US Natural Gas Fund (solid line) and the USO US Oil Fund (dashed line) are overlaid.

Of course, we don’t see a return to 2008 prices (over $14), perhaps in our lifetime. But at $4, the price would revert to the high of 2016 and at $5 and more it would be at 2014 highs. At $4, which is a reasonable target for Natural Gas should Crude Oil prices stay at or rise above $60-$70, industry profits would be substantial.
Another catalyst for Nat Gas prices is the weather. Nat Gas bulls are hoping for cold weather this winter, and that’s just what the Farmer’s Almanac is forecasting.
Colder—But Not Colder Than Usual. This winter is forecast to be much colder than last year’s, but—just like last winter—not colder than usual.
The southwest U.S. including California is expected to have a colder winter this year and one third of energy commodities consumed in that region is Natural Gas.
Today, we will be reviewing the finances and operations of ten Nat Gas companies of which nine have been candidates for investment in our fund, Chesapeake Energy Corporation being the exception.
| AR | Antero Resources Corporation | |
| COG | Cabot Oil & Gas Corporation | |
| CHK | Chesapeake Energy Corporation | |
| DVN | Devon Energy Corporation | |
| EQT | EQT Corporation | |
| GPOR | Gulfport Energy Corporation | |
| NFX | Newfield Exploration Company | |
| RRC | Range Resources Corporation | |
| SWN | Southwestern Energy Company | |
| WPX | WPX Energy, Inc. |

We presently own shares of three of the ten companies, DVN, NFX and GPOR, and we did hold EQT during September.
Using fundamental screens from Thomson Reuters, 4-Traders.com and Bloomberg, we can tell you that Chesapeake Energy is inferior in many ways, but none of the ten are considered strong. With higher 10% to 25% higher Nat Gas prices, these stock prices ought to get a substantial boost.
The data we used below is from 4-traders.com, which happens to be substantially different from Bloomberg’s, so be wary of the following numbers. We show them because we first look for outliers and then we check other sources from there.
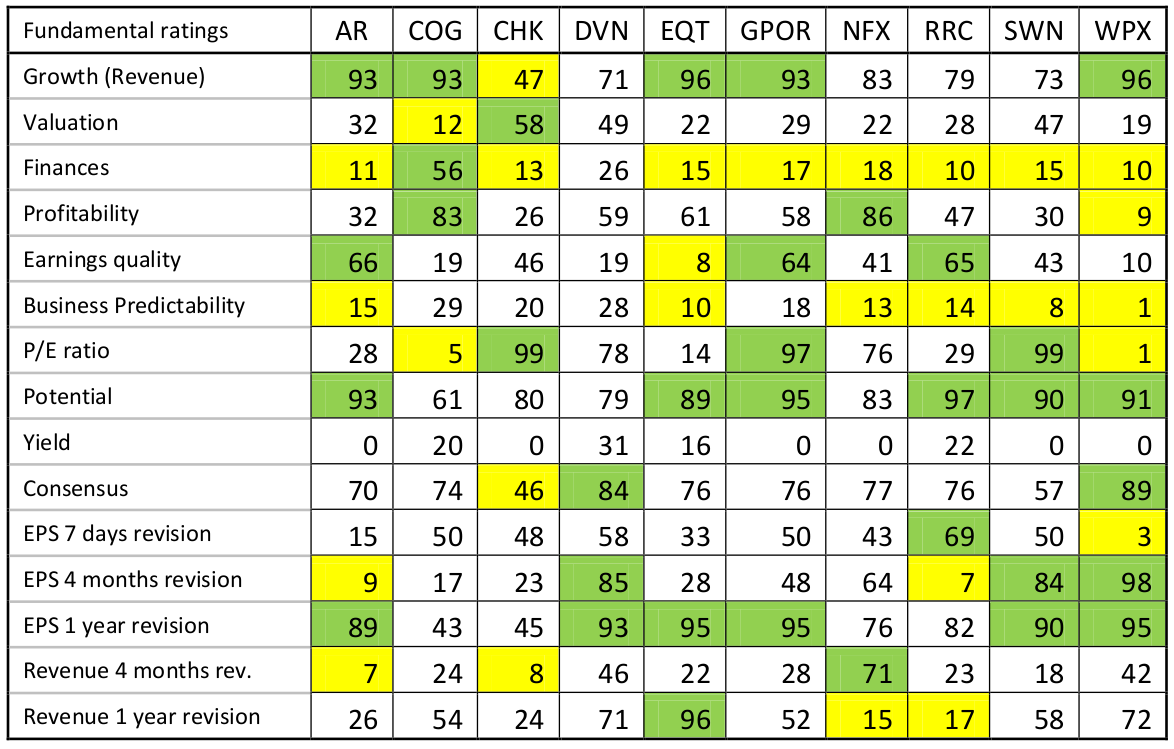
Briefly there are 15 fundamental ranking criteria we reviewed using data at the November 21 (Tuesday) close.
Fundamental Rankings:
1. Revenue Growth, which is based on the evolution of the turnover of the company between the last year and the three coming years according to consensus estimates. The higher the growth is (from a relative viewpoint), the better the rating is. The goal is to rank companies according to estimated sales and to identify companies with the highest growth.
1. Winners: EQT, WPX, AR, COG and GPOR are showing excellent growth compared to many thousands of reporting companies
2. Losers: CHK is the worst
2. Valuation, which is based on the ratio between enterprise value and its turnover for the current fiscal year and the next one. The lower the valuation is, the better the rating is. The goal is to rank companies according to valuation and to identify companies with the lowest valuation.
1. Winners: CHK is showing the best value because the stock is out of favor
2. Losers: COG, but most are poor
3. Finances, which is based on the evolution of the net debt of the company (debt or cash) and its EBITDA, compared to its revenue. The higher the cash is, the better the rating is. The goal is to rank companies according to financial situation and to identify companies with the highest growth. The goal is to rank companies according to the quality of their financial situation.
1. Winners: COG is best of a bad lot
2. Losers: All the rest
4. Profitability, which is based on net margin of the company for the current year and the next one according to consensus estimates. The higher the ratio is, the better the rating is. The goal is to rank companies according to the “Net income/revenue” ratio to identify those which have a high payoff.
1. Winners: NFX and COG are very good
2. Losers: WPX is bad
5. Earnings Quality, which is based on quality of past earnings released by the company compared to analysts’ estimates. The better earnings release is, the higher the rating is. The companies closest to the consensus will have an average score. The goal is to identify companies that publish regularly above consensus.
1. Winners: AR, RRC and GPOR are fairly good
2. Losers: WPX is bad
6. Business Predictability, which is based on the dispersion of analysts’ estimates on the evolution of the company business in the coming years (range estimates). The more estimates are concentrated, the more the rating is high. The goal is to rank companies according to the predictability of their business and identify companies whose business is highly predictable.
1. Winners: none show analysts much clarity going forward
2. Losers: all of them
7. Price Earnings Ratio, which compared the company’s current share price to its per-share earnings for the current fiscal year and the next one. The lower the PER is, the better the rating is. The goal is to rank companies according to their earnings multiples and identify those which are cheap.
1. Winners: CHK, SWN and GPOR
2. Losers: WPX and COG
8. Upside Price Potential, which is based on the average target price fixed by the consensus from Thomson Reuters. The higher the target price is, the better the rating is. The goal is to identify companies that have, according to analysts, the strongest upside potential.
1. Winners: With stock prices so low, most have good potential, the best being RRC, GPOR, AR, WPX, SWN and EQT
2. Losers: COG although there is still fairly good upside per the analysts who follow it
9. Yield, which is based on the dividend relative to its share price. The higher the dividend yield is, the better the rating is. The goal is to identify companies that can supply a significant dividend return to their shareholders.
1. Winners: none
2. Losers: all are low or zero dividend payers
10. Consensus, which is based on analyst recommendations. It provides an indication of the position taken by most analysts polled by Thomson Reuters. The goal is to identify companies that benefit from the maximum of buy (or sell) recommendations.
1. Winners: WPX and DVN
2. Losers: CHK
11. EPS revisions (one week), which is based on the evolution of EPS (earnings per share) revisions of
the company for the current fiscal year and the next one. During the last week, more EPS estimates are revised upward (from a relative point of view), the more rating is high. The goal is to rank companies according to analyst estimates and to identify companies with the best EPS estimates.
1. Winners: RRC
2. Losers: WPX
12. EPS revisions (four months), which is based on the evolution of EPS (earnings per share) revisions of the company for the current fiscal year and the next one. During the last four months, more EPS estimates are revised upward (from a relative point of view), the more rating is high. The goal is to rank companies according to analyst estimates and to identify companies with the best EPS estimates. The difference is that the period of observation is based on fourth month instead of one week.
1. Winners: WPX, DVN and SWN
2. Losers: RRC and AR
13. EPS revisions (one year), which is based on the evolution of EPS (earnings per share) revisions of the company for the current fiscal year and the next one. The more EPS estimates are revised upward (from a relative point of view), the more rating is high. The goal is to rank companies according to analyst estimates and to identify companies with the best EPS estimates. The difference is that the period is three times as long as EPS revisions (four months).
1. Winners: EQT, GPOR, WPX, DVN, SWN and AR
2. Losers: COG, but it is not bad
14. Revenue revisions (four months), which is based on the evolution of revenue revisions of the company for the current fiscal year and the next one. The more revenue estimates are revised upward (from a relative point of view), the more rating is high. The goal is to rank companies according to analyst estimates and to identify companies with the best revenue estimates.
1. Winners: NFX
2. Losers: AR and CHK
15. Revenue revisions (one year), which is based on the evolution of revenue revisions of the company for the current fiscal year and the next one. The more revenue estimates are revised upward (from a relative point of view), the more rating is high. The goal is to rank companies according to analyst estimates and to identify companies with the best revenue estimates. The difference is that the period is three times as long as Revenue revisions (four months).
1. Winners: EQT
2. Losers: NFX and RRC
Quantitative data is studied for outliers that may reflect risks or opportunities that should be explored further from an investment perspective. In many cases, the work is unproductive. More important, especially as we see it with these Natural Gas companies, is the study of corporate presentations, latest financial reports and Management Discussion & Analysis (MD&A).
In our case, several studies led us to taking four positions in these Natural Gas-weighted stocks in early to mid-September. Fairly quickly we decided to exit EQT and probably should have also sold GPOR as we are presently down -10.1% on the position. The NFX and DVN positions presently are up +3.1% and +7.1%. Thankfully, our Crude Oil-weighted holdings, save for Crescent Point Energy (CPG), which is down just – 2.2%, have led to overall profitability.
Our anticipation in early September that Nat Gas stocks would stay closer to the whole Oil & Gas field going forward was unjustified. However, if and when the commodity price picks up the pace a little more than it has in recent weeks, we expect our three NG choices will become stretch runners. We are patient investors.
Yes, as we know, investing is more a long-distance race than short track.